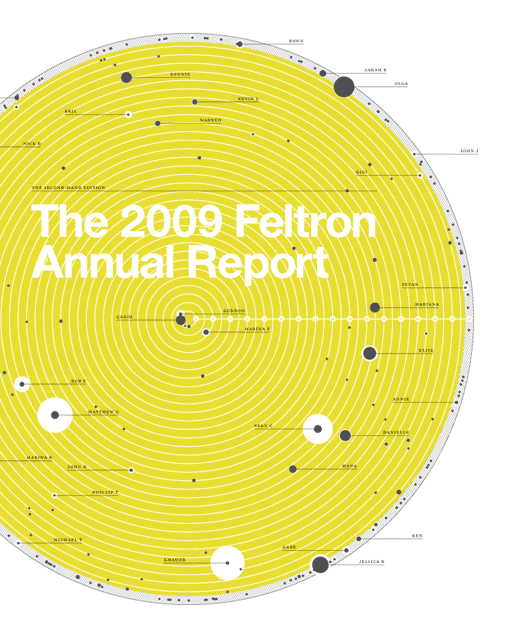
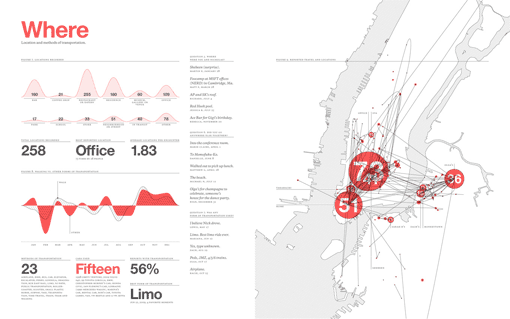
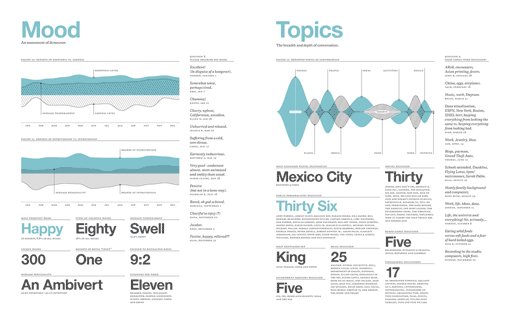
Infographic designer extraordinaire, Nicholas Felton, has just released his 2009 annual report. Each year I continue to be inspired by the new ways he comes up with to both record and visualize information. This time around Felton collected the data through online surveys, by requesting various information from those with whom he had meaningful encounters each day. Then the results were grouped into big picture categories like Relationships and Activities, and then broken down from there.
You can pre-order the print version in his shop, which is currently being letterpressed by Swayspace, which I would highly recommend. I own the past three versions so I can personally vouch for the quality.


Definitely make sure to click over to his site for larger images so you can get a better look at all the details.


